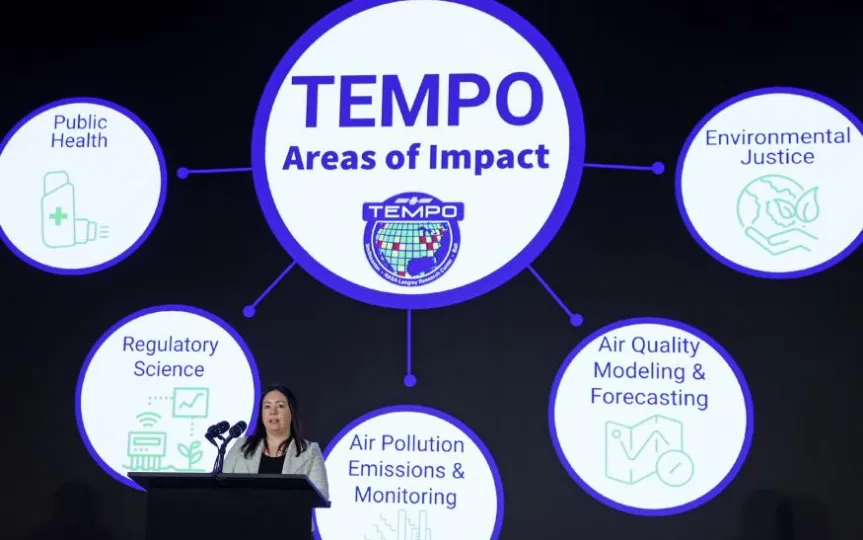
NASA Unveils Pollution Data Collected by TEMPO Satellite Tool
NASA has released the initial maps generated by its recently launched pollution instrument called TEMPO (Tropospheric Emissions: Monitoring of Pollution). While it comes as no surprise that the data highlights elevated pollution levels in urban regions, this innovative tool will enable scientists to conduct more detailed studies on the air quality in North America on an hourly basis. In a press release, NASA Administrator Bill Nelson expressed his belief that TEMPO’s groundbreaking data will prove advantageous for neighborhoods and communities across the nation for many years to come.
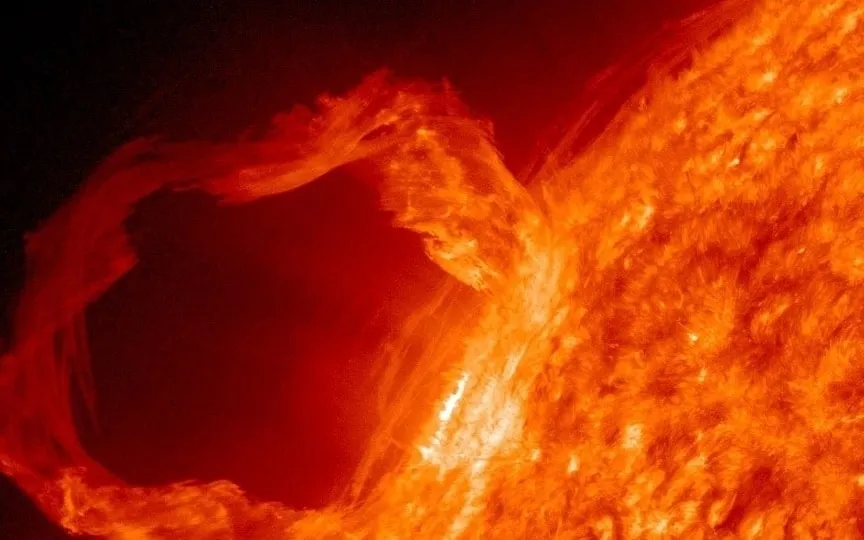
The instrument, launched in April and orbiting 22,000 miles above the equator, may help scientists better study the health effects of pollution at the “neighborhood scale.” It can take hourly measurements and provide insights into the effects of traffic congestion, smoke and ash from wildfires, and how fertilizer affects a farm. The tool measures sunlight bounced off the Earth’s surface, atmosphere and clouds. “Gases in the atmosphere absorb sunlight, and the resulting spectra are used to determine the concentrations of several gases in the air, including nitrogen dioxide,” NASA explained.
NASA says it shares its data with partners including the Environmental Protection Agency (EPA) and the National Oceanic and Atmospheric Administration (NOAA). Since the first measurements were taken earlier this month, teams have been busy checking and calibrating the satellite’s systems ahead of regular hourly operations starting in October. NASA sees the data as a boon in its efforts to meet the Biden administration’s climate goals.
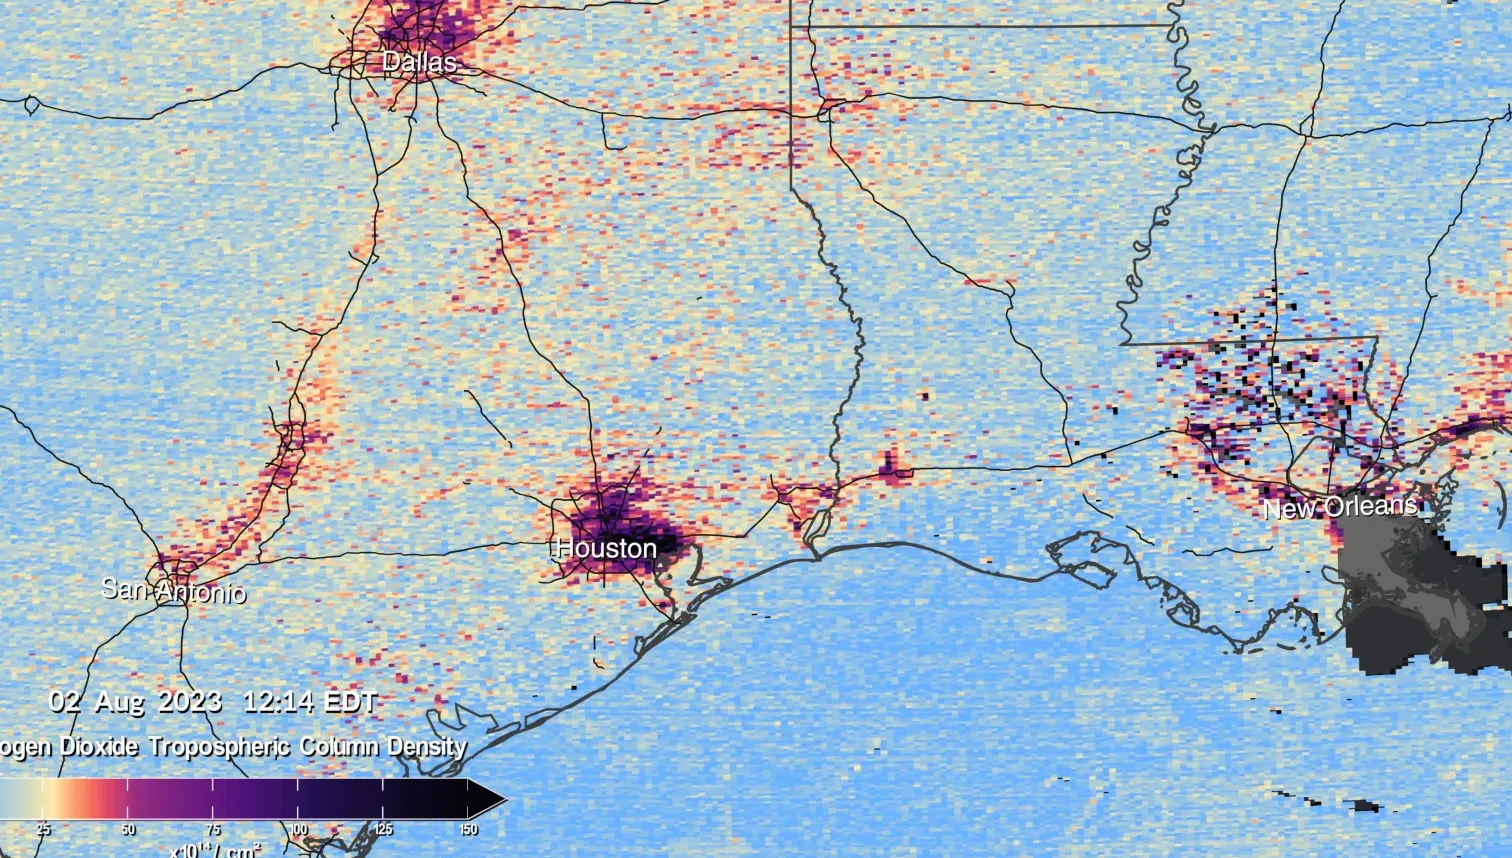
The instrument returned its first images on August 2, showing the I-95 corridor in the northeast (the New York, Philadelphia, and Washington, DC areas), a slice of the south (Central and East Texas extending to New Orleans), and a portion of the southwest (Los Angeles to Las Vegas). As expected, the maps reveal heavy nitrogen dioxide density in cities and their suburban sprawl.
“Detailed views of three regions show high nitrogen dioxide concentrations in cities in the morning and elevated nitrogen dioxide concentrations along major highways,” NASA wrote today. “As the day progresses, the morning’s pollution often evaporates. Later in the afternoon, it rises again as cities enter the second rush hour of the day.”
“This summer, millions of Americans felt firsthand the impact of wildfire smoke on our health,” said Nelson. “NASA and the Biden-Harris administration are committed to making it easier for everyday Americans and policymakers to access and use TEMPO data to monitor and improve the quality of the air we breathe, benefiting life here on Earth.”